
Guidance · No. 07
Make better decisions, and prove they worked
Most engineering organizations have never had more data about their own performance. Delivery metrics from Jira, Azure DevOps, and GitHub. Adoption dashboards for every new tool. Flow analytics, DORA scorecards, portfolio roll-ups, AI usage reports. And yet the questions that actually decide budgets still go unanswered in the executive review: Did the transformation work? Where is AI actually helping? Why does throughput lag headcount? Where can we cut without breaking delivery?
This is the paradox most large digital organizations live in. They are data-rich and performance-poor. More visibility than ever, and no better decisions or more certainty than before.
The reason is not that the dashboards are wrong. It is that they only do one part of the job. They show you what is happening and then stop. The rest of the work, the part where data turns into a defensible decision, is left to you. That gap has a shape, and once you see it, you cannot unsee it. We call closing it the closed loop.
What “closing the loop” actually means
A performance decision has four moves in it, whether you make them explicitly or not:
Run all four and you have a loop: every action feeds back as evidence, and the next decision is better than the last. Skip any of them and the loop stays open. An open loop is a report. A closed loop is a system that gets smarter every cycle.
Underneath those four moves runs a continuous engine. The AI is always collecting signals, from the engineering tools teams already use, from lightweight check-ins, from the flow of work itself, and diagnosing patterns in them. Patterns become insights. Insights become actions. Actions become reflections on what actually changed. And reflections become learnings, the evidence base that makes the next cycle sharper. It does not wake up once a quarter when someone opens a report. It runs continuously, which is what lets the loop compound instead of resetting every time.
Why dashboards leave the loop open
Think about what a dashboard genuinely does. It aggregates data you already have and renders it. That is the “see” step, and good dashboards do it well.
But a dashboard cannot tell you why a number moved, because the “what” data alone does not contain the cause. It cannot tell you what to do next, because it has no model of your context. And it cannot tell you whether last quarter’s intervention actually worked, because it was never designed to connect an action to its outcome. So the number goes up, or down, and the room fills with competing explanations and confident opinions. The loop never closes. You are back where you started, with better graphics.
This is not a knock on dashboards. It is a description of their job. The problem starts when an organization mistakes a reporting layer for a decision layer and wonders why more dashboards never produce better decisions.
Walking the loop, step by step
Here is what each move looks like when the loop is actually closed.
1. See what is happening, both halves of the picture
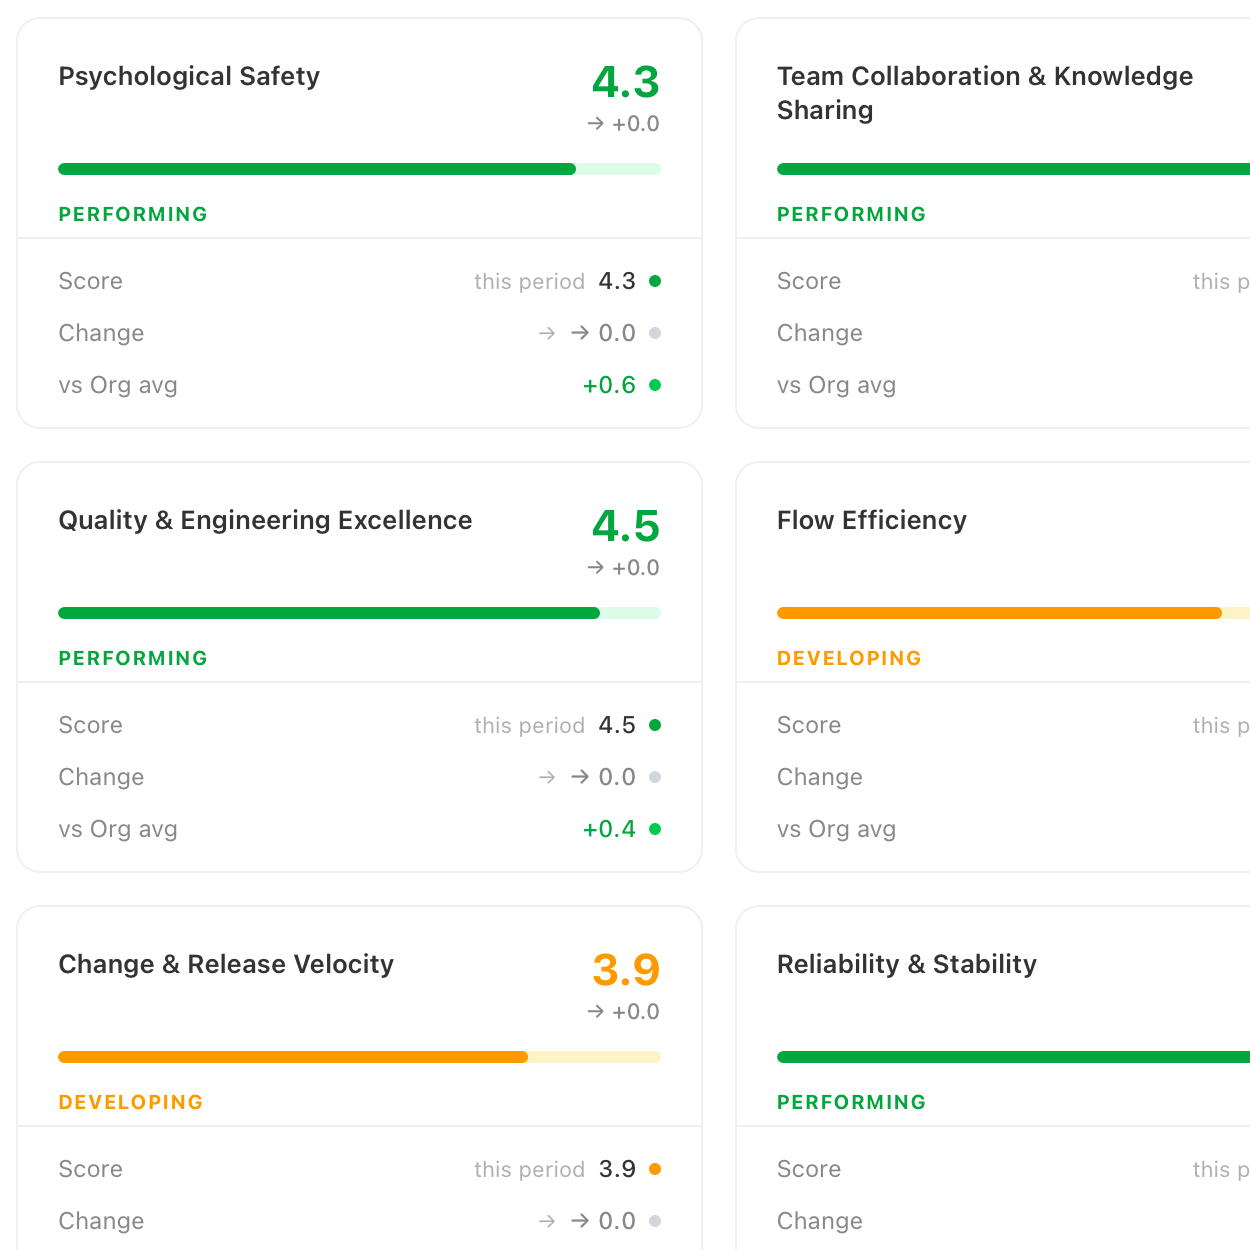
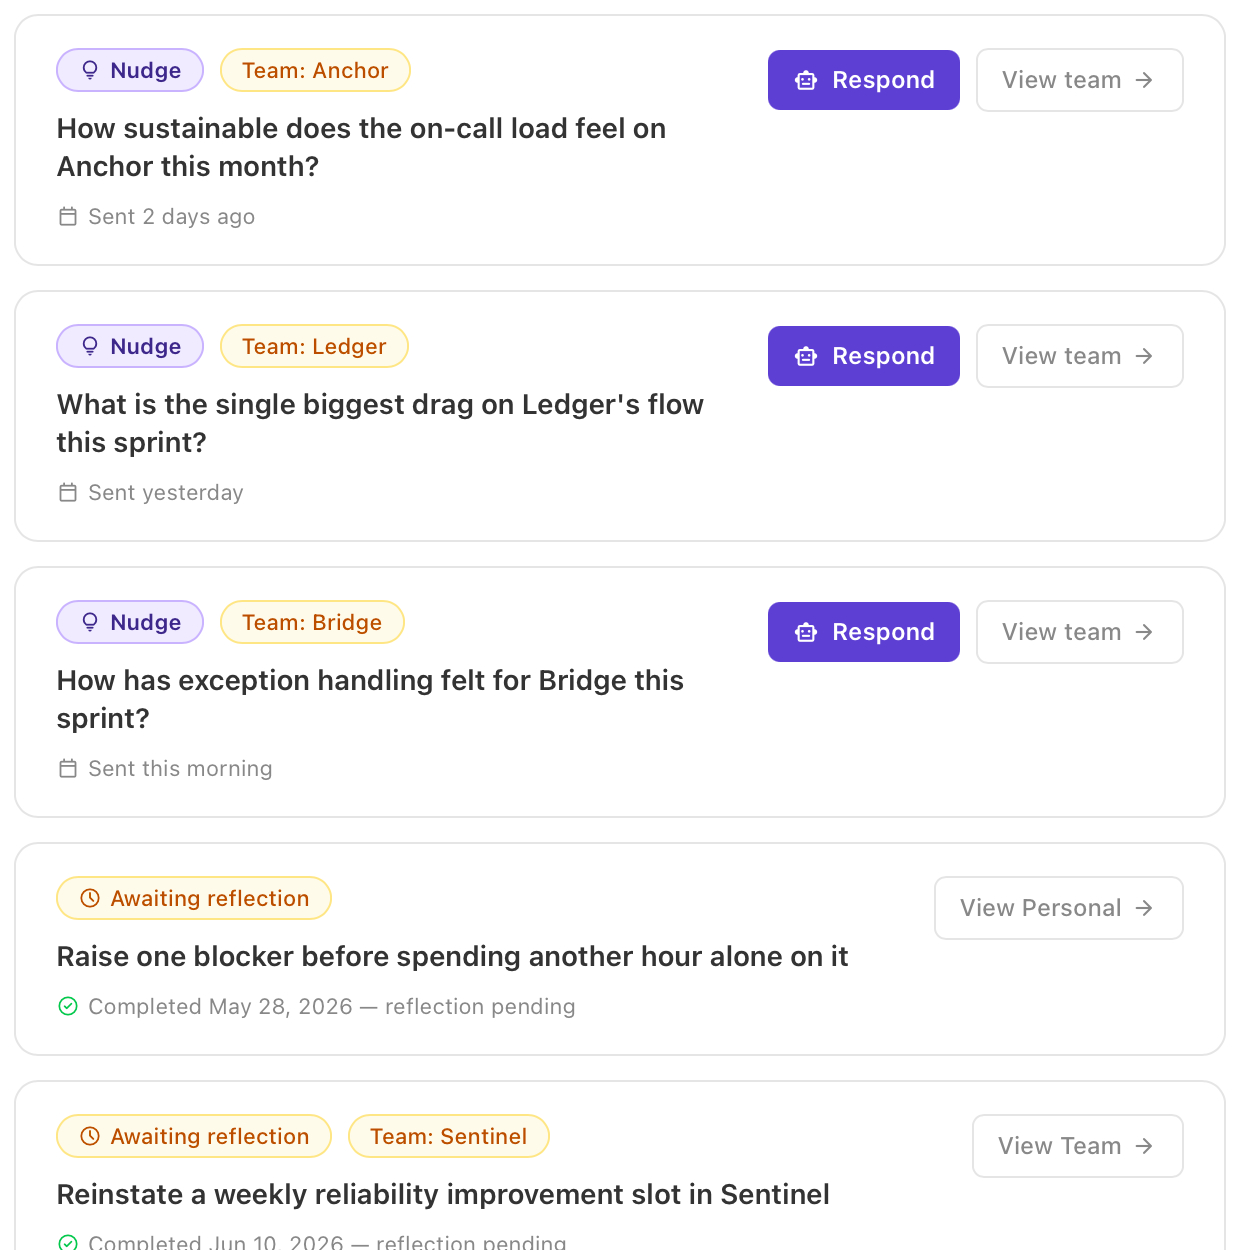
The first move is only as good as the data underneath it, and most tools see just one half of the picture. Delivery telemetry from Jira, Azure DevOps, and GitHub explains what is being delivered. Continuous human signals, things like psychological safety, cognitive load, collaboration, and engagement, captured in the flow of work rather than through periodic surveys, explain why. The two are not kept in separate reports: the human signals feed into the same performance dimensions as the delivery data, aggregated into one combined score per dimension. Either half alone is incomplete. Together, as a single set of scores, they make cause and effect visible instead of leaving you to guess at it.
2. Understand why
Seeing a dip is not the same as understanding it. The “understand” move is where the two halves of the data get read together, so a drop in throughput is traced to rising cognitive load or a spike in unplanned work rather than blamed on the nearest available team.
The reading is not ad hoc. Signals feed a set of research-backed performance models, one for each level of the organization, and it is those models that turn raw signals into a score a leader can act on. The Team Performance Model scores how a team is executing, the Product Value & Growth Performance Model scores whether a product is translating work into value, and the Portfolio Performance Intelligence Model scores whether the wider investment system is working. Every dimension in a model is driven by the signals underneath it, so a score is never a black box: you can always trace it back to what moved it.
This is also where fairness matters. An SRE team and a product team do different work and should not be judged against the same yardstick. Adaptive fairness logic adjusts the signals by team type, maturity, and context, so the explanation reflects how a team actually operates. And because individual behavior stays visible only to the individual, leaders see team-level patterns, not surveillance. The explanation is honest, and it is one people will accept.
3. Guide the next step
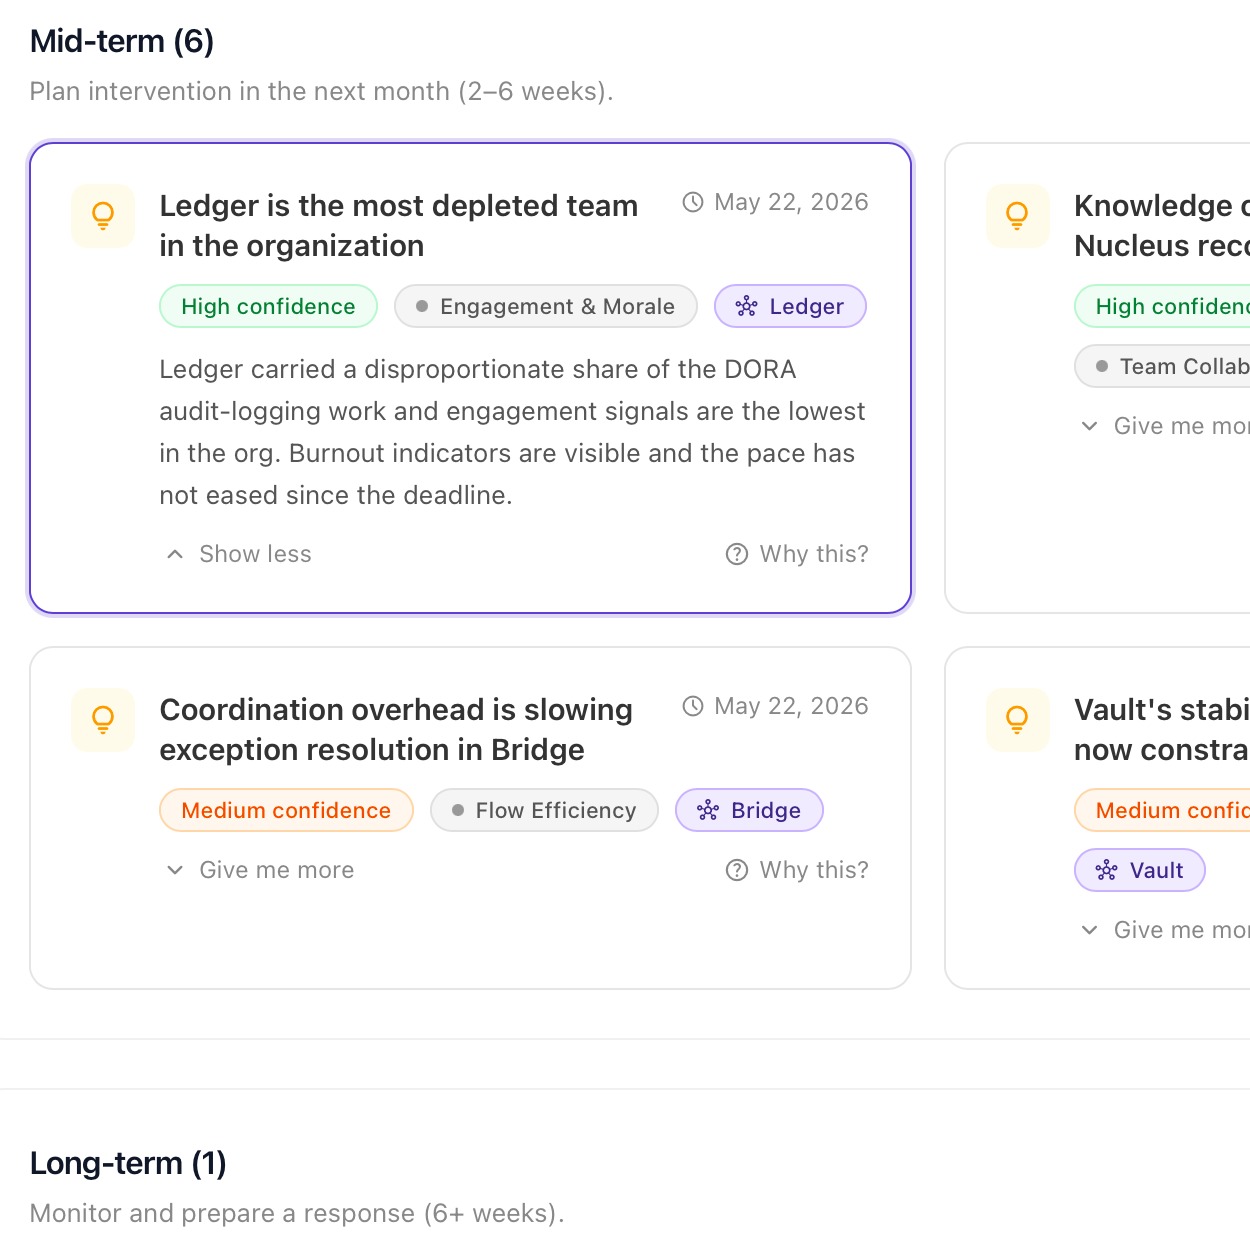
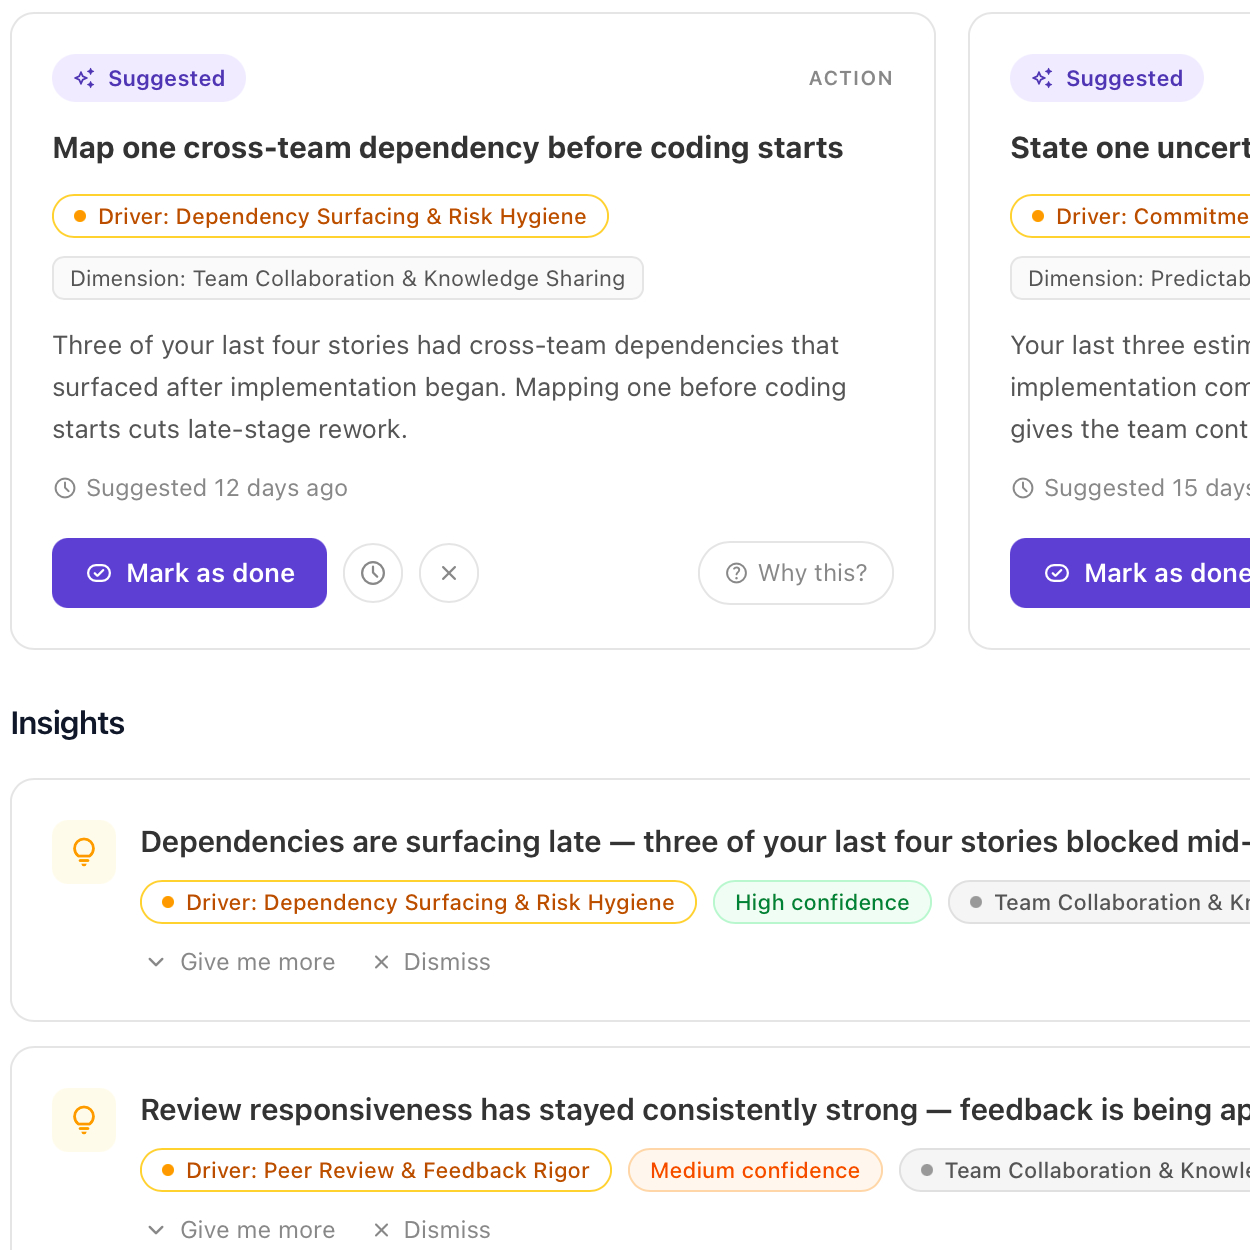
Once the what and the why are clear, the question is simply: so what do we do about it? Guidance arrives in two forms. The platform surfaces recommended actions directly, concrete next steps tied to what the signals and models are showing, so the guidance is not left buried in a chart waiting to be interpreted. And where a leader wants to go deeper, a context-aware, role-aware AI chat answers in the context of their own data. A director asks why their group’s lead time has crept up and gets an answer grounded in their own numbers, not a generic best-practice article. A team lead asks what to prioritize this sprint and gets a specific, defensible suggestion. It is the difference between a tool that hands you a chart and a tool that tells you what to do with it and lets you interrogate the reasoning.
For the person doing the work, a mentor, a team lead, a director, this is where the loop earns its keep. The explanation and the guidance together are what let them first understand what is really going on, then decide what to do, and then act on it with confidence rather than on a hunch. Understanding without a next step is just a better report. The guide move is what turns understanding into a decision and a decision into action.
4. Prove it worked
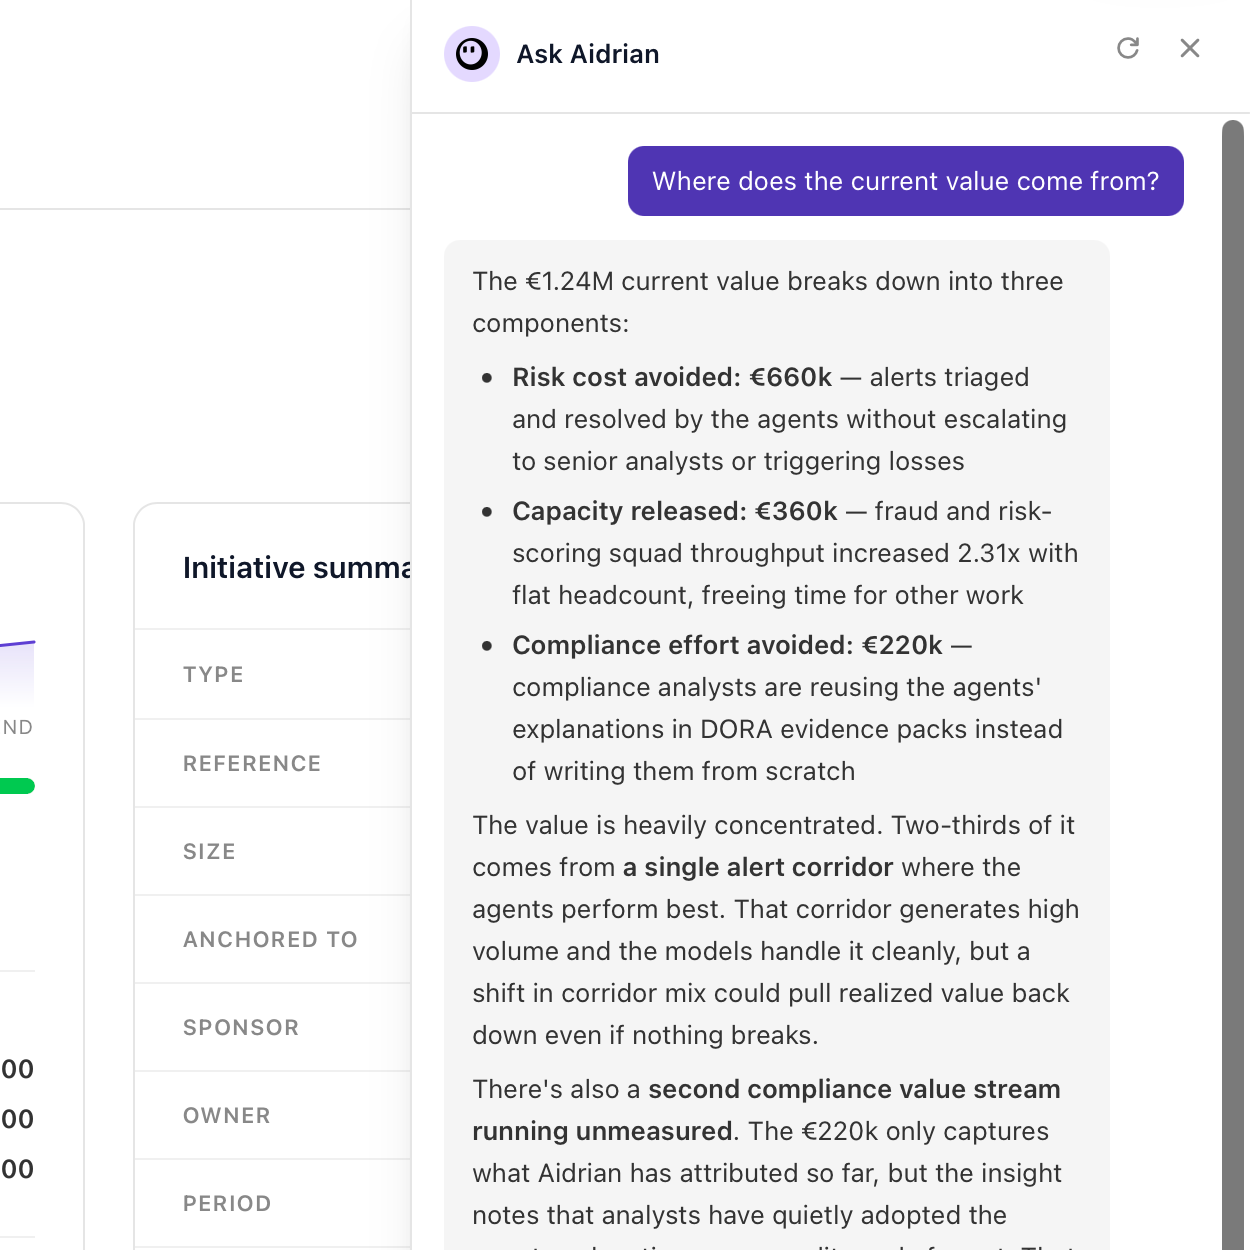
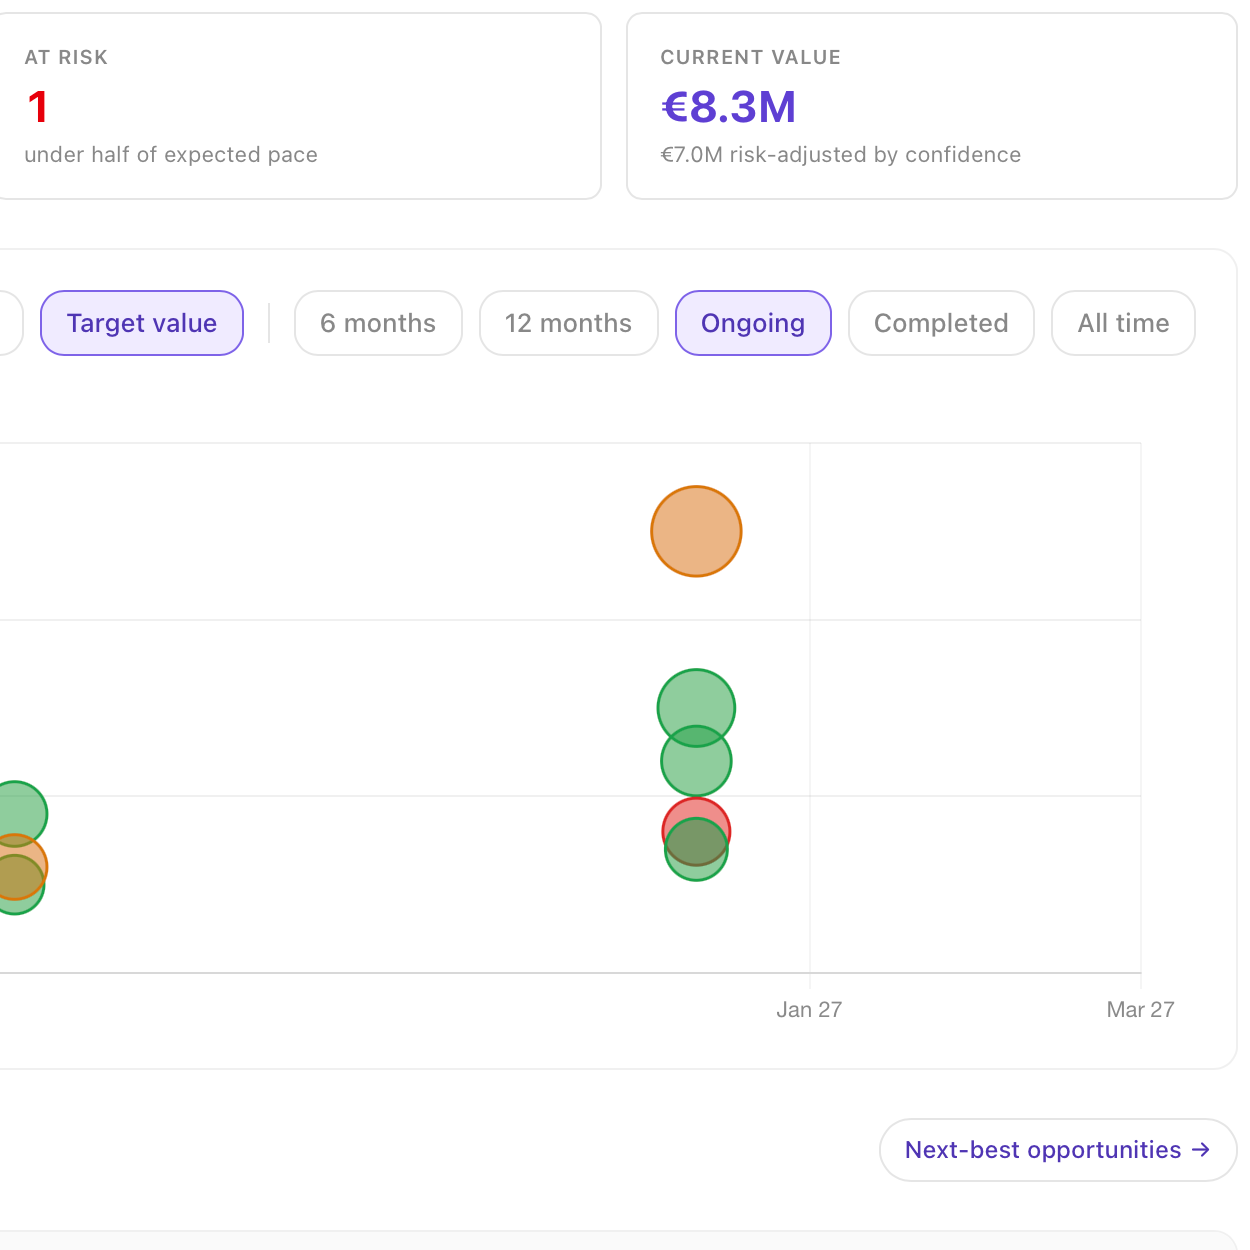
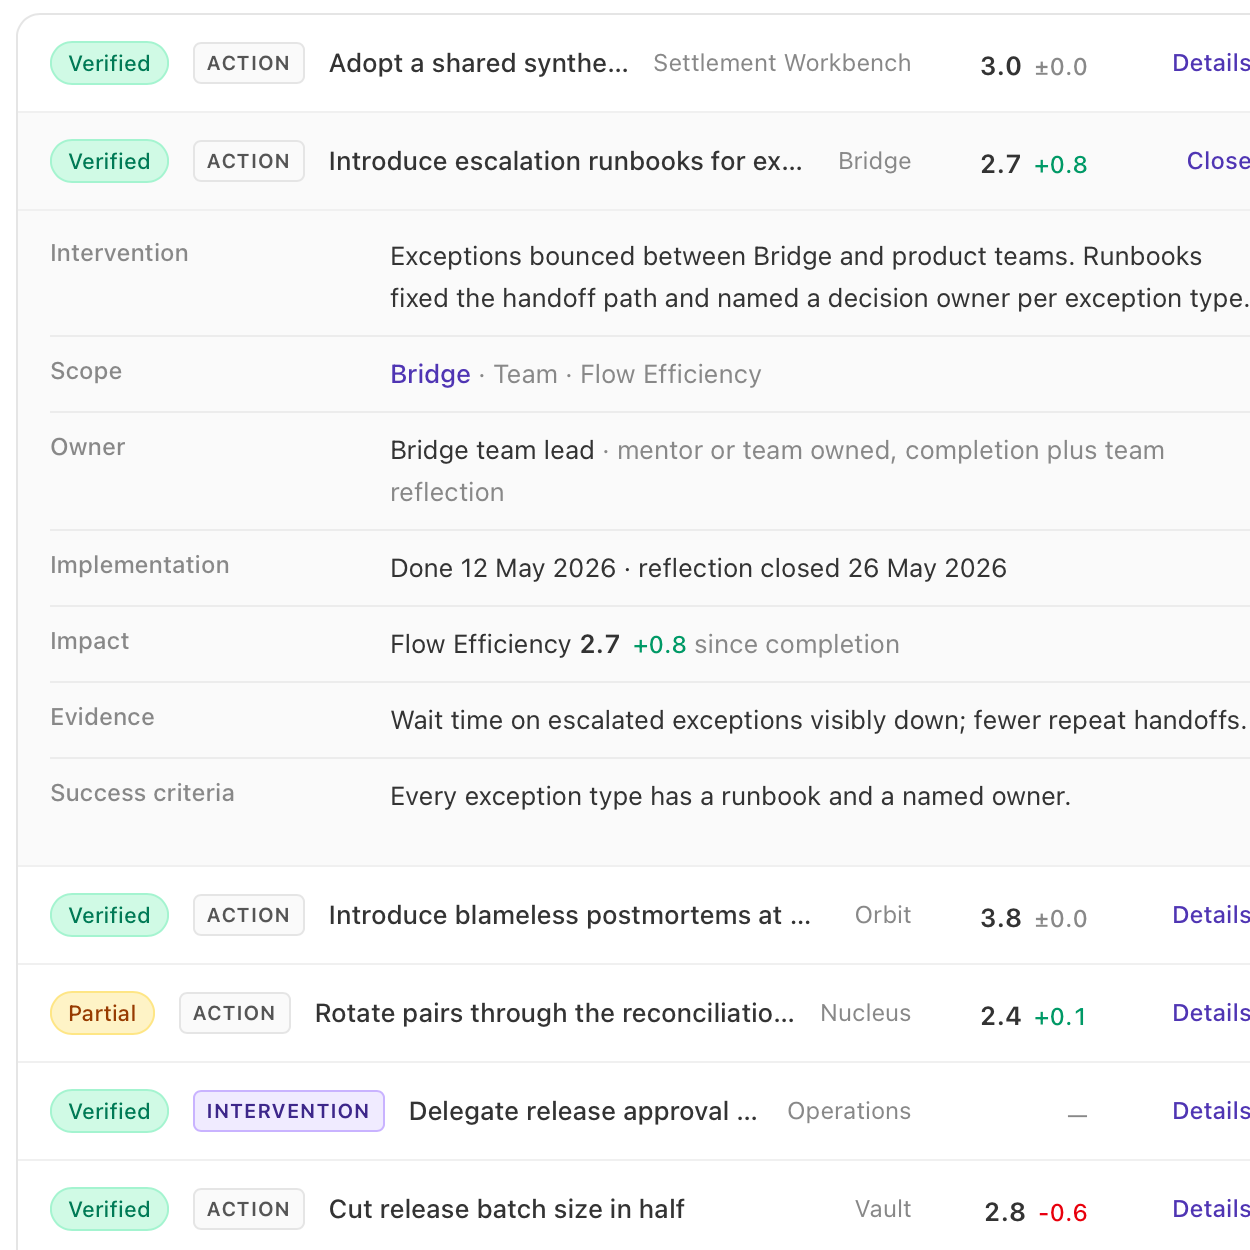
The last move is the one that earns trust with a board. Every initiative, a transformation program, an AI rollout, a team-level change, gets tracked against before-and-after performance data. Did the intervention move cycle time, quality, collaboration, cognitive load? You can show the answer with evidence instead of a story.
This is what turns “we think it is working” into “here is what changed, and here is the data.” It is also what makes AI impact honest: measured by what actually changes when AI enters the workflow, not by how many seats were activated. And once you can prove an outcome, that proof becomes the new baseline. The loop closes, and the next decision starts from firmer ground.
The loop runs at every level
The same four moves apply whether you are looking at an individual, a single team, a product, or an entire portfolio. That matters more than it sounds, because problems rarely announce themselves where they originate.
The loop even runs for the individual engineer, privately. Each person gets their own closed loop, their own signals, insights, and evidence of what is improving, and none of it is exposed to their manager. Leaders only ever see team-level patterns. That is a deliberate design choice, not a limitation: it is what makes the personal loop genuinely useful to the person living in it, and what keeps the whole system defensible to teams and works councils.
These levels are not separate reports, they are one connected structure. Individuals roll up into teams, teams into products, products into portfolios, and initiatives such as a transformation program or an AI rollout run across all of them at once. Because it is a single structure rather than four disconnected views, the loop can trace a symptom at one level back to a cause at another.
A portfolio carrying too much work in flight quietly degrades execution three layers down. Strong team execution paired with weak product outcomes is not a delivery problem, it is a steering problem. Rising AI investment with no movement in team or product signals is adoption theater, not transformation. You can only see these relationships if the loop runs across levels rather than in one isolated view.
That is why the loop sits inside a set of connected performance models: a Team Performance Model for the execution layer, a Product Value and Growth Performance Model for the product layer, a Portfolio Performance Intelligence Model above them, and an emerging agentic AI performance model for the layer taking shape now. The point is not more dashboards at more levels. It is the ability to find a problem where it actually starts, which is often a layer away from where it shows up.
Why this matters now
Go back to the questions from the start, the ones that go unanswered in the executive review. Did the transformation work? Where is AI actually helping? Why does throughput lag headcount? Where can we cut without breaking delivery? Every one of them is a closed-loop question. Each needs you to see what is happening, understand why, act, and prove the action changed the number. An open loop cannot answer any of them, which is why more dashboards never made the questions go away.
Transformation raises the stakes. Every reorg, every platform migration, every AI rollout arrives with a story about the value it will create and a budget attached to that story. The gap between activity and impact is where the money quietly disappears. Adoption is an activity number: seats filled, teams migrated, tools switched on. Impact is a number with a currency sign in front of it. A closed loop is how you tell the two apart, because real improvement leaves a trace in cycle time, quality, and the health of the people doing the work, and activity on its own does not.
The organizations that win the next few years will not be the ones with the most dashboards. They will be the ones that can see what happened, understand why, decide what to do, and prove it worked, over and over, faster than everyone else.
That is the loop. Closing it is the whole game.